A detailed cost blueprint for self-reliant Indian villages of 1,000 to 10,000 people — covering energy, food, water, livelihood, and infrastructure
By Team Neutral Odisha News | Field reporting from BAIF Development Research Foundation, Uruli Kanchan, Pune | Organized by Earth Journalism Network
The Question India Refuses to Ask
Every election cycle, Indian villages are promised free electricity, free rations, free gas cylinders. The promises come, the votes go, and the village stays exactly where it was — dependent, idle, and waiting for the next handout. But what if, instead of spending thousands of crores on recurring subsidies, we asked a different question altogether:
What would it cost — once — to make a village completely self-sufficient?
Not partially. Not on paper. Completely. Energy from its own solar panels and wind turbines. Food from its own farms and fishponds. Water from its own harvesting systems. Cooking fuel from its own biogas digesters running on cow dung and cactus — the so-called “green gold.” Livelihoods built into the very fabric of the village economy.
This article attempts to answer that question with hard numbers in Indian Rupees, for villages of four sizes: 1,000, 2,500, 5,000, and 10,000 people. The numbers draw from real pilot projects, including the agrivoltaic installations and bio-resource centre at BAIF Development Research Foundation in Uruli Kanchan near Pune, visited as part of a field programme organised by the Earth Journalism Network.
What follows is not a utopian fantasy. Every technology mentioned here is already deployed somewhere in India. The only thing missing is the will to put them together in one place.
What We Saw at BAIF: Agrivoltaics and the Green Gold
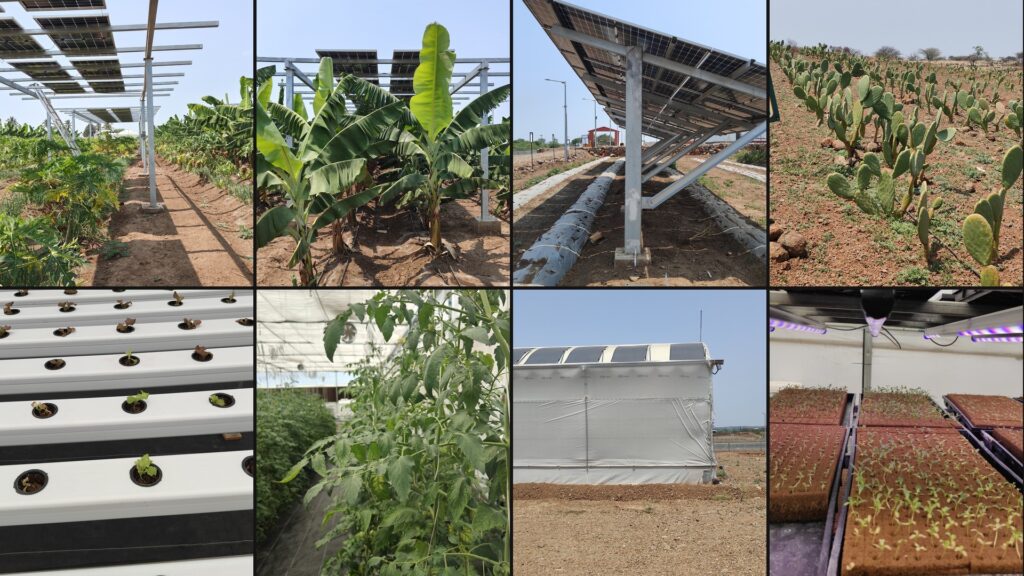
Before diving into numbers, some context. At BAIF’s 65-acre campus — spread over undulating terrain with four distinct soil types — researchers have built what may be India’s most comprehensive demonstration of climate-smart agriculture. Thirteen different agrivoltaic models are operational here, proving that solar panels and farming are not competitors for land but partners on it.
The agrivoltaic installations include:
- Elevated panels (climate-smart building structure, 1.5–1.8 m clearance, 4 m height) — 40 kW capacity, with crops growing underneath in filtered sunlight
- Vertical bifacial panels — 20 kW, allowing tractors and animals to pass between rows
- Fixed-tilt inclined panels — 24 kW, optimised for energy yield with shade-tolerant crops below
- Floating solar panels — 3 kW, installed on farm ponds, reducing evaporation while generating power
- Flexible panels — 10 kW, draped over polyhouse structures
- Rooftop panels on polyhouses — 6 kW units powering greenhouses with hydroponic systems inside
To see these installations in action, watch: Types of Solar Panels at BAIF Pilot Project and Agrivoltaic Farming at BAIF. For the full interview with the Chief Thematic Programme Executive, Dr. Vitthal Kauthale, see this video.
Adjacent to the solar fields, BAIF’s bio-resource centre showcases spineless cactus — a xerophyte now being championed by the Government of India as an energy crop. Cactus produces up to 100 metric tons of biomass per hectare per year, thrives in desert-like soil, and serves four functions the researchers summarise as food, fodder, fuel, and fashion (yes, they have made vegan leather from it). For biogas, cactus is remarkable: its methane yield matches cow dung, and after an initial seeding period with 90% dung and 10% cactus, the ratio can be reversed entirely. The government’s Department of Land Resources has set a target of 10,000 hectares of cactus plantation across Indian states, with BAIF as the lead agency.
The campus also houses indigenous cattle herds, organic input production units, a green hydrogen cooking pilot with IIT Bombay (one litre of water can cook food for four people per day), and a 500 sq. m. polyhouse with hydroponics.
Everything described in this article’s cost model either exists at BAIF or is commercially available in India today.
Foundational Assumptions
Before building the cost model, we fix certain parameters. These can be adjusted — and the article provides a mechanism for doing so — but the baseline is as follows.
Demographics:
| Parameter | Assumption |
|---|---|
| Average family size | 5 members |
| Families for pop. 1,000 | 200 |
| Families for pop. 2,500 | 500 |
| Families for pop. 5,000 | 1,000 |
| Families for pop. 10,000 | 2,000 |
| Baseline diet split | 50% veg, 50% non-veg |
| Working-age adults (18–60) | 55% of population |
| Children (0–17) | 35% of population |
| Elderly (60+) | 10% of population |
The Veg/Non-Veg Factor (V-NV Ratio):
The cost of food production changes significantly with dietary patterns. A fully vegetarian village needs less land, water, and energy than a village where everyone eats meat, eggs, and fish. To make this model flexible, we introduce a dietary adjustment factor:
- At 50% non-vegetarian population, the factor is 1.0x (baseline).
- At 100% vegetarian, the factor drops to approximately 0.70x for food-related costs (less land for animal rearing, less water, less feed crop area).
- At 100% non-vegetarian, it rises to approximately 1.35x.
- The formula: Dietary Factor = 0.70 + (0.65 × proportion of non-veg population)
All food and land costs in this article use the 1.0x baseline. Readers and policymakers can multiply food-related line items by the appropriate factor for their village’s actual dietary composition.
1. Energy: Electricity for Every Need
A sustainable village must generate all its own electricity from renewable sources. This covers households, farms, irrigation, community buildings, street lighting, a sports centre, a primary health centre, schools, and small enterprises.
1.1 Estimating Total Electricity Demand
Household (lights, fans, TV, fridge, phone charging, small appliances) Per-unit: 150 kWh/month per family
| Pop. 1,000 | Pop. 2,500 | Pop. 5,000 | Pop. 10,000 |
|---|---|---|---|
| 30,000 kWh/mo | 75,000 | 1,50,000 | 3,00,000 |
Irrigation (borewells, pumps — 5 HP avg.) Per-unit: 300 kWh/month per pump
| Pop. 1,000 | Pop. 2,500 | Pop. 5,000 | Pop. 10,000 |
|---|---|---|---|
| 6,000 (20 pumps) | 15,000 (50) | 30,000 (100) | 60,000 (200) |
Street lighting (LED, 40W, dusk-to-dawn) Per-unit: 10 kWh/month per light
| Pop. 1,000 | Pop. 2,500 | Pop. 5,000 | Pop. 10,000 |
|---|---|---|---|
| 1,500 (150 lights) | 3,500 (350) | 7,000 (700) | 14,000 (1,400) |
Community centre / Panchayat office — 500 kWh/month
| Pop. 1,000 | Pop. 2,500 | Pop. 5,000 | Pop. 10,000 |
|---|---|---|---|
| 500 | 1,000 (×2) | 2,000 (×4) | 4,000 (×8) |
Primary health centre — 800 kWh/month
| Pop. 1,000 | Pop. 2,500 | Pop. 5,000 | Pop. 10,000 |
|---|---|---|---|
| 800 | 800 | 1,600 (×2) | 3,200 (×4) |
Schools (primary + secondary) — 400 kWh/month each
| Pop. 1,000 | Pop. 2,500 | Pop. 5,000 | Pop. 10,000 |
|---|---|---|---|
| 800 (×2) | 1,200 (×3) | 2,000 (×5) | 4,000 (×10) |
Sports centre (floodlights, equipment) — 1,500 kWh/month
| Pop. 1,000 | Pop. 2,500 | Pop. 5,000 | Pop. 10,000 |
|---|---|---|---|
| 1,500 | 1,500 | 3,000 (×2) | 6,000 (×4) |
Small enterprises / workshops — 200 kWh/month each
| Pop. 1,000 | Pop. 2,500 | Pop. 5,000 | Pop. 10,000 |
|---|---|---|---|
| 2,000 (10 units) | 5,000 (25) | 10,000 (50) | 20,000 (100) |
Cold storage for produce — 2,000 kWh/month per unit
| Pop. 1,000 | Pop. 2,500 | Pop. 5,000 | Pop. 10,000 |
|---|---|---|---|
| 2,000 (×1) | 4,000 (×2) | 8,000 (×4) | 16,000 (×8) |
Water treatment / purification plant — 1,000 kWh/month
| Pop. 1,000 | Pop. 2,500 | Pop. 5,000 | Pop. 10,000 |
|---|---|---|---|
| 1,000 | 1,000 | 2,000 | 4,000 |
Biogas plant operations — 500 kWh/month per plant
| Pop. 1,000 | Pop. 2,500 | Pop. 5,000 | Pop. 10,000 |
|---|---|---|---|
| 500 (×1) | 1,000 (×2) | 2,000 (×4) | 4,000 (×8) |
TOTAL MONTHLY DEMAND (kWh)
| Pop. 1,000 | Pop. 2,500 | Pop. 5,000 | Pop. 10,000 |
|---|---|---|---|
| 47,100 | 1,08,000 | 2,17,600 | 4,35,200 |
TOTAL ANNUAL DEMAND (kWh)
| Pop. 1,000 | Pop. 2,500 | Pop. 5,000 | Pop. 10,000 |
|---|---|---|---|
| 5,65,200 | 12,96,000 | 26,11,200 | 52,22,400 |
1.2 Solar Capacity Required
Assuming average solar generation of 4.5 kWh per kW-peak per day in most of peninsular India (accounting for monsoon months, dust, and degradation), and a 1.25x oversize factor for storage losses and peak demand:
| Village Size | Annual Demand | Capacity Needed |
|---|---|---|
| 1,000 | 5,65,200 kWh | ~430 kWp |
| 2,500 | 12,96,000 kWh | ~985 kWp (~1 MWp) |
| 5,000 | 26,11,200 kWh | ~1,985 kWp (~2 MWp) |
| 10,000 | 52,22,400 kWh | ~3,970 kWp (~4 MWp) |
1.3 The Agrivoltaic Advantage
Following the BAIF model, at least 60% of solar capacity should be agrivoltaic — elevated, vertical, or inclined structures that allow farming underneath. This means solar land is also farm land. The remaining 40% can be rooftop (households, community buildings) and floating (on farm ponds).
1.4 Energy Cost Breakdown (in INR)
Current installed costs in India (2025–26 benchmarks):
- Ground-mount / agrivoltaic solar: INR 45,000–55,000 per kWp (with mounting structures suitable for farming underneath, average INR 50,000/kWp)
- Rooftop solar: INR 55,000–65,000 per kWp (average INR 60,000/kWp)
- Battery Energy Storage System (BESS): INR 8,000 per kWh for lithium-ion; each village needs roughly 4–6 hours of storage for evening/night use
- Small wind turbines (5–10 kW each, as supplementary): INR 3,00,000 per unit installed
- Mini-grid infrastructure (distribution, smart meters, inverters, cabling): ~INR 15,000 per household + community network
Agrivoltaic solar (60% of capacity @ INR 50,000/kWp)
| Pop. 1,000 | Pop. 2,500 | Pop. 5,000 | Pop. 10,000 |
|---|---|---|---|
| INR 1.29 Cr | INR 2.96 Cr | INR 5.96 Cr | INR 11.91 Cr |
Rooftop solar (30% @ INR 60,000/kWp)
| Pop. 1,000 | Pop. 2,500 | Pop. 5,000 | Pop. 10,000 |
|---|---|---|---|
| INR 0.77 Cr | INR 1.77 Cr | INR 3.57 Cr | INR 7.15 Cr |
Floating solar (10% @ INR 55,000/kWp)
| Pop. 1,000 | Pop. 2,500 | Pop. 5,000 | Pop. 10,000 |
|---|---|---|---|
| INR 0.24 Cr | INR 0.54 Cr | INR 1.09 Cr | INR 2.18 Cr |
Battery storage (4 hrs avg.)
| Pop. 1,000 | Pop. 2,500 | Pop. 5,000 | Pop. 10,000 |
|---|---|---|---|
| INR 1.51 Cr | INR 3.46 Cr | INR 6.97 Cr | INR 13.94 Cr |
Small wind turbines (2–10 units)
| Pop. 1,000 | Pop. 2,500 | Pop. 5,000 | Pop. 10,000 |
|---|---|---|---|
| INR 0.06 Cr | INR 0.15 Cr | INR 0.30 Cr | INR 0.60 Cr |
Mini-grid & distribution
| Pop. 1,000 | Pop. 2,500 | Pop. 5,000 | Pop. 10,000 |
|---|---|---|---|
| INR 0.45 Cr | INR 1.00 Cr | INR 2.00 Cr | INR 4.00 Cr |
TOTAL ENERGY CAPITAL COST
| Pop. 1,000 | Pop. 2,500 | Pop. 5,000 | Pop. 10,000 |
|---|---|---|---|
| INR 4.32 Cr | INR 9.88 Cr | INR 19.89 Cr | INR 39.78 Cr |
2. Food: Feeding Every Mouth, Every Nutrient
A self-sufficient village must grow all its staple grains, pulses, oilseeds, vegetables, fruits, dairy, eggs, poultry, and fish locally. The land requirement depends heavily on the veg/non-veg ratio.
2.1 Nutritional Requirements (per person per year)
Based on ICMR dietary guidelines for Indians:
| Food Category | Annual Need/Person | Yield/Acre | Acres per 1,000 |
|---|---|---|---|
| Cereals | 180 kg | 1,800 kg | 100 |
| Pulses/legumes | 35 kg | 600 kg | 58 |
| Vegetables | 120 kg | 8,000 kg | 15 |
| Fruits | 50 kg | 6,000 kg | 8 |
| Oilseeds | 15 kg | 800 kg | 19 |
| Spices | 5 kg | 1,500 kg | 3 |
| Crop subtotal | 203 acres |
| Animal/Fish | Need/Person | Yield | Land |
|---|---|---|---|
| Dairy (200 ml/day) | 73 litres | 8 L/day/cow | 30 acres |
| Eggs (50% non-veg) | 100 eggs | 300/hen/yr | 0.5 acres |
| Poultry (50% non-veg) | 10 kg | 2.5 kg/broiler | 1 acre |
| Fish (50% non-veg) | 8 kg | 3,000 kg/acre/yr | 1.5 acres |
| Animal subtotal | 33 acres | ||
| Fodder & feed crops | — | — | 25 acres |
| TOTAL per 1,000 | ~261 acres |
Note: With agrivoltaic dual-use on roughly 50–60 acres of the crop area, the effective additional land for solar is zero — the same land serves both purposes.
2.2 Land Requirement Summary
Village of 1,000 — Total: 350 acres Crop: 203 | Animal/Grazing/Fodder: 58 | Cactus: 15 | Residential: 30 | Buffer/Commons: 44
Village of 2,500 — Total: 850 acres Crop: 508 | Animal/Grazing/Fodder: 145 | Cactus: 35 | Residential: 60 | Buffer/Commons: 102
Village of 5,000 — Total: 1,650 acres Crop: 1,015 | Animal/Grazing/Fodder: 290 | Cactus: 65 | Residential: 100 | Buffer/Commons: 180
Village of 10,000 — Total: 3,250 acres Crop: 2,030 | Animal/Grazing/Fodder: 580 | Cactus: 120 | Residential: 180 | Buffer/Commons: 340
2.3 Food Production Capital Cost (in INR)
This covers land development, soil improvement, seeds, saplings, orchards, polyhouses, hydroponics, livestock purchase, poultry sheds, fish ponds, cold storage, and farm equipment.
Land development & soil improvement (INR 30,000/acre)
| Pop. 1,000 | Pop. 2,500 | Pop. 5,000 | Pop. 10,000 |
|---|---|---|---|
| INR 0.78 Cr | INR 1.92 Cr | INR 3.72 Cr | INR 7.35 Cr |
Irrigation infrastructure (drip, sprinkler, channels)
| Pop. 1,000 | Pop. 2,500 | Pop. 5,000 | Pop. 10,000 |
|---|---|---|---|
| INR 0.60 Cr | INR 1.40 Cr | INR 2.70 Cr | INR 5.20 Cr |
Seeds, saplings, orchard establishment
| Pop. 1,000 | Pop. 2,500 | Pop. 5,000 | Pop. 10,000 |
|---|---|---|---|
| INR 0.15 Cr | INR 0.35 Cr | INR 0.65 Cr | INR 1.25 Cr |
Polyhouses with hydroponics (500 sq.m. each)
| Pop. 1,000 | Pop. 2,500 | Pop. 5,000 | Pop. 10,000 |
|---|---|---|---|
| INR 0.25 Cr (×1) | INR 0.50 Cr (×2) | INR 1.00 Cr (×4) | INR 2.00 Cr (×8) |
Dairy cattle (indigenous improved breed @ INR 50,000/cow)
| Pop. 1,000 | Pop. 2,500 | Pop. 5,000 | Pop. 10,000 |
|---|---|---|---|
| INR 0.18 Cr (35) | INR 0.44 Cr (88) | INR 0.88 Cr (175) | INR 1.75 Cr (350) |
Cattle sheds & dairy processing
| Pop. 1,000 | Pop. 2,500 | Pop. 5,000 | Pop. 10,000 |
|---|---|---|---|
| INR 0.20 Cr | INR 0.45 Cr | INR 0.85 Cr | INR 1.60 Cr |
Poultry units
| Pop. 1,000 | Pop. 2,500 | Pop. 5,000 | Pop. 10,000 |
|---|---|---|---|
| INR 0.08 Cr | INR 0.18 Cr | INR 0.35 Cr | INR 0.65 Cr |
Fish ponds (excavation, fingerlings, aerators)
| Pop. 1,000 | Pop. 2,500 | Pop. 5,000 | Pop. 10,000 |
|---|---|---|---|
| INR 0.10 Cr | INR 0.22 Cr | INR 0.40 Cr | INR 0.75 Cr |
Farm machinery (tractors, tillers, harvesters — shared)
| Pop. 1,000 | Pop. 2,500 | Pop. 5,000 | Pop. 10,000 |
|---|---|---|---|
| INR 0.30 Cr | INR 0.65 Cr | INR 1.20 Cr | INR 2.20 Cr |
Cold storage units
| Pop. 1,000 | Pop. 2,500 | Pop. 5,000 | Pop. 10,000 |
|---|---|---|---|
| INR 0.15 Cr | INR 0.30 Cr | INR 0.60 Cr | INR 1.20 Cr |
Cactus plantation establishment (INR 40,000/acre)
| Pop. 1,000 | Pop. 2,500 | Pop. 5,000 | Pop. 10,000 |
|---|---|---|---|
| INR 0.06 Cr | INR 0.14 Cr | INR 0.26 Cr | INR 0.48 Cr |
Grain storage / warehousing
| Pop. 1,000 | Pop. 2,500 | Pop. 5,000 | Pop. 10,000 |
|---|---|---|---|
| INR 0.10 Cr | INR 0.22 Cr | INR 0.40 Cr | INR 0.75 Cr |
TOTAL FOOD & AGRICULTURE CAPITAL
| Pop. 1,000 | Pop. 2,500 | Pop. 5,000 | Pop. 10,000 |
|---|---|---|---|
| INR 2.95 Cr | INR 6.77 Cr | INR 13.01 Cr | INR 25.18 Cr |
3. Water: Harvesting, Storing, Treating
3.1 Water Demand
Total water need per person per day (domestic + irrigation + livestock): approximately 150 litres domestic + share of irrigation. Irrigation is the dominant consumer — roughly 70% of total village water use.
| Use | Daily/Capita | Annual (Pop. 1,000) |
|---|---|---|
| Domestic | 150 litres | 54.75 ML |
| Livestock | 30 litres | 10.95 ML |
| Irrigation | 400 litres | 146.00 ML |
| Community | 20 litres | 7.30 ML |
| Total | 600 litres | 219 ML |
3.2 Water Sources Strategy
The model assumes no perennial river. If a river is present, costs drop by 20–30% for this section. The strategy is:
- Rainwater harvesting from every rooftop and open area, channelled into recharge pits and storage tanks
- Farm ponds (minimum 2 per 100 acres of cropland) for irrigation storage — also hosting floating solar
- Borewells with solar-powered pumps as supplementary groundwater source
- Community water treatment plant (RO + UV for drinking water)
- Wastewater recycling — greywater treated and reused for irrigation
3.3 Water Infrastructure Cost (in INR)
Farm ponds (excavation, lining — INR 3L each)
| Pop. 1,000 | Pop. 2,500 | Pop. 5,000 | Pop. 10,000 |
|---|---|---|---|
| INR 0.21 Cr (7) | INR 0.51 Cr (17) | INR 0.99 Cr (33) | INR 1.95 Cr (65) |
Rooftop rainwater harvesting (INR 15,000/house)
| Pop. 1,000 | Pop. 2,500 | Pop. 5,000 | Pop. 10,000 |
|---|---|---|---|
| INR 0.30 Cr | INR 0.75 Cr | INR 1.50 Cr | INR 3.00 Cr |
Check dams / percolation tanks (2–5)
| Pop. 1,000 | Pop. 2,500 | Pop. 5,000 | Pop. 10,000 |
|---|---|---|---|
| INR 0.20 Cr | INR 0.40 Cr | INR 0.70 Cr | INR 1.20 Cr |
Borewells with solar pumps (INR 3.5L each)
| Pop. 1,000 | Pop. 2,500 | Pop. 5,000 | Pop. 10,000 |
|---|---|---|---|
| INR 0.35 Cr (10) | INR 0.70 Cr (20) | INR 1.40 Cr (40) | INR 2.80 Cr (80) |
Piped water distribution network
| Pop. 1,000 | Pop. 2,500 | Pop. 5,000 | Pop. 10,000 |
|---|---|---|---|
| INR 0.40 Cr | INR 0.85 Cr | INR 1.60 Cr | INR 3.00 Cr |
Drinking water treatment plant (RO+UV)
| Pop. 1,000 | Pop. 2,500 | Pop. 5,000 | Pop. 10,000 |
|---|---|---|---|
| INR 0.15 Cr | INR 0.25 Cr | INR 0.45 Cr | INR 0.80 Cr |
Wastewater treatment & recycling
| Pop. 1,000 | Pop. 2,500 | Pop. 5,000 | Pop. 10,000 |
|---|---|---|---|
| INR 0.20 Cr | INR 0.40 Cr | INR 0.75 Cr | INR 1.40 Cr |
Overhead / ground storage tanks
| Pop. 1,000 | Pop. 2,500 | Pop. 5,000 | Pop. 10,000 |
|---|---|---|---|
| INR 0.15 Cr | INR 0.30 Cr | INR 0.55 Cr | INR 1.00 Cr |
TOTAL WATER CAPITAL
| Pop. 1,000 | Pop. 2,500 | Pop. 5,000 | Pop. 10,000 |
|---|---|---|---|
| INR 1.96 Cr | INR 4.16 Cr | INR 7.94 Cr | INR 15.15 Cr |
4. Cooking Fuel: Biogas from Cow Dung and Cactus
As demonstrated at BAIF, community biogas plants running on cow dung and spineless cactus can fully replace LPG cylinders. The BAIF model shows that after initial seeding with 90% cow dung, the ratio can shift to 90% cactus and 10% dung, making the system viable even with modest cattle herds.
4.1 Biogas Demand
Each family needs roughly 2–3 cubic metres of biogas per day for cooking (equivalent to one LPG cylinder per month). A well-run community biogas plant of 50 cubic metre capacity serves approximately 20–25 families.
| Village Size | Families | Plants Needed | Daily Demand (m³) |
|---|---|---|---|
| 1,000 | 200 | 8–10 | 500 |
| 2,500 | 500 | 20–25 | 1,250 |
| 5,000 | 1,000 | 40–50 | 2,500 |
| 10,000 | 2,000 | 80–100 | 5,000 |
4.2 Feedstock
Each 50 m³ plant needs approximately 1,500–2,000 kg of feedstock daily. The cactus plantation (15–120 acres depending on village size) produces 100 metric tons per acre per year, which is more than sufficient. Cattle dung supplements the feedstock and provides the essential microbial culture.
A bonus: the slurry from biogas digestion is rich biofertiliser, replacing chemical fertilisers entirely on the village farms. This is a closed loop — crops and cactus feed the digester, the digester feeds the soil, the soil feeds the crops.
4.3 Biogas Capital Cost (in INR)
Community biogas plants (INR 8L per 50 m³ plant)
| Pop. 1,000 | Pop. 2,500 | Pop. 5,000 | Pop. 10,000 |
|---|---|---|---|
| INR 0.80 Cr (10) | INR 2.00 Cr (25) | INR 4.00 Cr (50) | INR 8.00 Cr (100) |
Gas piping / distribution to homes
| Pop. 1,000 | Pop. 2,500 | Pop. 5,000 | Pop. 10,000 |
|---|---|---|---|
| INR 0.25 Cr | INR 0.55 Cr | INR 1.00 Cr | INR 1.80 Cr |
Biogas stoves (INR 3,000 each household)
| Pop. 1,000 | Pop. 2,500 | Pop. 5,000 | Pop. 10,000 |
|---|---|---|---|
| INR 0.06 Cr | INR 0.15 Cr | INR 0.30 Cr | INR 0.60 Cr |
Slurry management & composting yards
| Pop. 1,000 | Pop. 2,500 | Pop. 5,000 | Pop. 10,000 |
|---|---|---|---|
| INR 0.08 Cr | INR 0.18 Cr | INR 0.32 Cr | INR 0.55 Cr |
TOTAL BIOGAS CAPITAL
| Pop. 1,000 | Pop. 2,500 | Pop. 5,000 | Pop. 10,000 |
|---|---|---|---|
| INR 1.19 Cr | INR 2.88 Cr | INR 5.62 Cr | INR 10.95 Cr |
5. Infrastructure: Building the Village
A self-sufficient village is not just farms and panels. It needs homes, roads, schools, healthcare, governance buildings, a sports facility, and digital connectivity.
Note – Assuming Infrastructre exists in the villages, new Infra cost should be allocated separately.
5.1 Infrastructure Repair Cost (in INR)
Internal roads (gravel + cement, INR 15L/km)
| Pop. 1,000 | Pop. 2,500 | Pop. 5,000 | Pop. 10,000 |
|---|---|---|---|
| INR 0.60 Cr (4 km) | INR 1.20 Cr (8 km) | INR 2.25 Cr (15 km) | INR 4.20 Cr (28 km) |
Community centre / Panchayat bhavan
| Pop. 1,000 | Pop. 2,500 | Pop. 5,000 | Pop. 10,000 |
|---|---|---|---|
| INR 0.20 Cr | INR 0.35 Cr (×2) | INR 0.60 Cr (×3) | INR 1.00 Cr (×5) |
Primary health centre with basic lab
| Pop. 1,000 | Pop. 2,500 | Pop. 5,000 | Pop. 10,000 |
|---|---|---|---|
| INR 0.35 Cr | INR 0.35 Cr | INR 0.70 Cr (×2) | INR 1.40 Cr (×4) |
Primary school building
| Pop. 1,000 | Pop. 2,500 | Pop. 5,000 | Pop. 10,000 |
|---|---|---|---|
| INR 0.25 Cr | INR 0.50 Cr (×2) | INR 0.75 Cr (×3) | INR 1.50 Cr (×6) |
Secondary / high school
| Pop. 1,000 | Pop. 2,500 | Pop. 5,000 | Pop. 10,000 |
|---|---|---|---|
| INR 0.40 Cr | INR 0.40 Cr | INR 0.80 Cr (×2) | INR 1.60 Cr (×4) |
Sports centre (multipurpose ground, equipment, floodlights)
| Pop. 1,000 | Pop. 2,500 | Pop. 5,000 | Pop. 10,000 |
|---|---|---|---|
| INR 0.30 Cr | INR 0.30 Cr | INR 0.60 Cr (×2) | INR 1.20 Cr (×4) |
Sanitation (community toilets, sewer/septic)
| Pop. 1,000 | Pop. 2,500 | Pop. 5,000 | Pop. 10,000 |
|---|---|---|---|
| INR 0.30 Cr | INR 0.65 Cr | INR 1.20 Cr | INR 2.20 Cr |
Digital infrastructure (fibre/wifi, computer centre)
| Pop. 1,000 | Pop. 2,500 | Pop. 5,000 | Pop. 10,000 |
|---|---|---|---|
| INR 0.15 Cr | INR 0.25 Cr | INR 0.45 Cr | INR 0.80 Cr |
Market yard / weekly haat structure
| Pop. 1,000 | Pop. 2,500 | Pop. 5,000 | Pop. 10,000 |
|---|---|---|---|
| INR 0.10 Cr | INR 0.15 Cr | INR 0.25 Cr | INR 0.45 Cr |
Village library & skill centre
| Pop. 1,000 | Pop. 2,500 | Pop. 5,000 | Pop. 10,000 |
|---|---|---|---|
| INR 0.10 Cr | INR 0.15 Cr | INR 0.25 Cr | INR 0.45 Cr |
Solid waste management facility
| Pop. 1,000 | Pop. 2,500 | Pop. 5,000 | Pop. 10,000 |
|---|---|---|---|
| INR 0.10 Cr | INR 0.20 Cr | INR 0.35 Cr | INR 0.60 Cr |
Cremation / burial ground development
| Pop. 1,000 | Pop. 2,500 | Pop. 5,000 | Pop. 10,000 |
|---|---|---|---|
| INR 0.05 Cr | INR 0.08 Cr | INR 0.12 Cr | INR 0.20 Cr |
Temple / community worship space
| Pop. 1,000 | Pop. 2,500 | Pop. 5,000 | Pop. 10,000 |
|---|---|---|---|
| INR 0.10 Cr | INR 0.15 Cr | INR 0.20 Cr | INR 0.35 Cr |
TOTAL INFRASTRUCTURE CAPITAL
| Pop. 1,000 | Pop. 2,500 | Pop. 5,000 | Pop. 10,000 |
|---|---|---|---|
| INR 3.00 Cr | INR 4.73 Cr | INR 8.52 Cr | INR 15.95 Cr |
6. Livelihoods: The Engine of Sustainability
A village is not sustainable if its people have no work. The model must generate enough economic activity to employ every working-age adult. Here is how the village economy is structured:
Agriculture & allied activities (employs ~40% of workforce): Farming, dairy, poultry, fisheries, orchard management, polyhouse/hydroponic operations, cactus cultivation, biogas plant operation, organic input production.
Energy sector jobs (~10%): Solar panel cleaning and maintenance, battery management, mini-grid operations, meter reading, billing — creating a local energy utility managed by the village.
Value addition & processing (~20%): Grain milling, oil pressing, dairy processing (paneer, ghee, curd), fruit preservation, pickle/sauce making, cactus-based products (leather, food supplements, cosmetics), organic fertiliser packaging.
Services (~20%): Teaching, healthcare (ASHA workers, nurses), Panchayat administration, digital services (Common Service Centre), transport, retail, tailoring, carpentry.
Skilled trades & entrepreneurship (~10%): Electricians, plumbers, masons (for ongoing construction/repair), small IT/BPO centres enabled by village internet connectivity.
6.1 Livelihood Establishment Cost (in INR)
Skill training centre & programmes
| Pop. 1,000 | Pop. 2,500 | Pop. 5,000 | Pop. 10,000 |
|---|---|---|---|
| INR 0.15 Cr | INR 0.30 Cr | INR 0.55 Cr | INR 1.00 Cr |
Micro-enterprise seed fund (revolving)
| Pop. 1,000 | Pop. 2,500 | Pop. 5,000 | Pop. 10,000 |
|---|---|---|---|
| INR 0.25 Cr | INR 0.60 Cr | INR 1.10 Cr | INR 2.00 Cr |
Value-addition units (processing, packaging)
| Pop. 1,000 | Pop. 2,500 | Pop. 5,000 | Pop. 10,000 |
|---|---|---|---|
| INR 0.30 Cr | INR 0.65 Cr | INR 1.20 Cr | INR 2.20 Cr |
Common Service Centre (digital)
| Pop. 1,000 | Pop. 2,500 | Pop. 5,000 | Pop. 10,000 |
|---|---|---|---|
| INR 0.08 Cr | INR 0.08 Cr | INR 0.16 Cr | INR 0.32 Cr |
Cooperative / FPO establishment
| Pop. 1,000 | Pop. 2,500 | Pop. 5,000 | Pop. 10,000 |
|---|---|---|---|
| INR 0.05 Cr | INR 0.10 Cr | INR 0.15 Cr | INR 0.25 Cr |
Workshop / artisan spaces
| Pop. 1,000 | Pop. 2,500 | Pop. 5,000 | Pop. 10,000 |
|---|---|---|---|
| INR 0.10 Cr | INR 0.20 Cr | INR 0.35 Cr | INR 0.60 Cr |
TOTAL LIVELIHOOD CAPITAL
| Pop. 1,000 | Pop. 2,500 | Pop. 5,000 | Pop. 10,000 |
|---|---|---|---|
| INR 0.93 Cr | INR 1.93 Cr | INR 3.51 Cr | INR 6.37 Cr |
7. The Grand Total: Initial Capital Cost
Here is the complete picture — the one-time investment needed to build a fully self-sufficient, sustainable village.
7.1 Summary — Initial Capital Investment (in INR Crore)
Village of 1,000 people — TOTAL: INR 15.79 Cr Energy: 4.32 | Food & Agri: 2.95 | Water: 1.96 | Biogas: 1.19 | Infra: 3.00 | Livelihoods: 0.93 | Contingency (10%): 1.44 Per capita: INR 1,57,900 | Per family: INR 7,89,500
Village of 2,500 people — TOTAL: INR 33.39 Cr Energy: 9.88 | Food & Agri: 6.77 | Water: 4.16 | Biogas: 2.88 | Infra: 4.73 | Livelihoods: 1.93 | Contingency (10%): 3.04 Per capita: INR 1,33,560 | Per family: INR 6,67,800
Village of 5,000 people — TOTAL: INR 64.34 Cr Energy: 19.89 | Food & Agri: 13.01 | Water: 7.94 | Biogas: 5.62 | Infra: 8.52 | Livelihoods: 3.51 | Contingency (10%): 5.85 Per capita: INR 1,28,680 | Per family: INR 6,43,400
Village of 10,000 people — TOTAL: INR 124.72 Cr Energy: 39.78 | Food & Agri: 25.18 | Water: 15.15 | Biogas: 10.95 | Infra: 15.95 | Livelihoods: 6.37 | Contingency (10%): 11.34 Per capita: INR 1,24,720 | Per family: INR 6,23,600
The economies of scale are clear: the per-capita cost drops from INR 1.58 lakh for a small village to INR 1.25 lakh for a large one. A village of 10,000 people can be made entirely self-sufficient for approximately INR 125 crore. To put that in perspective, the Government of India’s annual subsidy on LPG alone exceeds INR 10,000 crore — enough to fund 80 such villages every year.
8. Annual Maintenance, Repair, and Replacement
No infrastructure lasts forever without upkeep. Here is the maintenance schedule and cost.
8.1 Annual Operation & Maintenance Cost (in INR Lakh/year)
Energy — Panel cleaning, inverter servicing, battery monitoring, grid maintenance
| Pop. 1,000 | Pop. 2,500 | Pop. 5,000 | Pop. 10,000 |
|---|---|---|---|
| 18 | 40 | 78 | 150 |
Agriculture — Seeds, fertiliser (from biogas slurry — mostly free), veterinary care, equipment diesel/service
| Pop. 1,000 | Pop. 2,500 | Pop. 5,000 | Pop. 10,000 |
|---|---|---|---|
| 25 | 58 | 110 | 210 |
Water — Pump maintenance, RO membrane replacement, pipe repairs, desilting ponds
| Pop. 1,000 | Pop. 2,500 | Pop. 5,000 | Pop. 10,000 |
|---|---|---|---|
| 10 | 22 | 40 | 75 |
Biogas — Plant maintenance, pipe leak repair, feedstock handling
| Pop. 1,000 | Pop. 2,500 | Pop. 5,000 | Pop. 10,000 |
|---|---|---|---|
| 8 | 18 | 34 | 65 |
Infrastructure — Road repair, building whitewash, electrical, plumbing, sports equipment
| Pop. 1,000 | Pop. 2,500 | Pop. 5,000 | Pop. 10,000 |
|---|---|---|---|
| 15 | 28 | 50 | 90 |
Salaries — Teachers, health workers, operators, admin
| Pop. 1,000 | Pop. 2,500 | Pop. 5,000 | Pop. 10,000 |
|---|---|---|---|
| 35 | 80 | 150 | 280 |
TOTAL ANNUAL O&M
| Pop. 1,000 | Pop. 2,500 | Pop. 5,000 | Pop. 10,000 |
|---|---|---|---|
| INR 1.11 Cr | INR 2.46 Cr | INR 4.62 Cr | INR 8.70 Cr |
8.2 Major Replacement Schedule
| Asset | Lifespan | Replacement Cost | When Due |
|---|---|---|---|
| Solar panels | 25 yrs | 70% of original | Year 25 |
| Batteries | 10–12 yrs | 50% (costs falling) | Yr 10, 20 |
| Inverters | 10–12 yrs | 40% | Yr 10, 20 |
| Biogas (civil) | 20–25 yrs | 30% (relining) | Year 20 |
| Biogas pipes | 15 yrs | 60% | Year 15 |
| Water pumps | 10–15 yrs | 80% | Yr 10, 20 |
| RO membranes | 3–5 yrs | In annual O&M | Ongoing |
| Farm machinery | 10–15 yrs | 70% | Year 10 |
| Roads | 10 yrs | 40% (resurfacing) | Yr 10, 20 |
| Buildings | 30+ yrs | 20% (major repairs) | Yr 15, 25 |
For a village of 1,000 people, the first major replacement cycle at Year 10 (batteries, inverters, pumps, machinery) would cost approximately INR 2.5–3.0 Cr. By that time, the village economy should be generating enough surplus to fund this from its own revenues.
9. Revenue, Surplus, and the Road to Self-Funding
A self-sufficient village is not a cost centre — it is an economy. Here is where revenue comes from:
9.1 Revenue Streams (Annual, for Pop. 1,000)
| Source | Annual Revenue |
|---|---|
| Surplus crop sales (20% beyond village consumption) | INR 30 Lakh |
| Dairy products (milk, ghee, paneer sold externally) | INR 25 Lakh |
| Surplus solar electricity sold to grid | INR 15 Lakh |
| Value-added products (processed food, organic inputs, cactus products) | INR 20 Lakh |
| Poultry & fish sales | INR 10 Lakh |
| Savings on avoided LPG (INR 1,200/cylinder × 12 × 200 families) | INR 29 Lakh |
| Savings on avoided electricity bills (INR 3/kWh × 5,65,200 kWh) | INR 17 Lakh |
| Carbon credits (solar + biogas) | INR 5 Lakh |
| Eco-tourism / educational visits | INR 5 Lakh |
| Total Annual Revenue + Savings | INR 1.56 Cr |
Against annual O&M of INR 1.11 Cr, the village generates a net surplus of approximately INR 45 Lakh per year from Year 2 onwards (Year 1 is establishment). By Year 5–7, cumulative surplus begins to build a replacement fund. By Year 10, the village should have INR 3–4 Cr in reserves — enough to cover the first major replacement cycle without external aid.
For larger villages, the surplus scales more than proportionally due to economies of scale in processing and marketing.
Payback by village size:
| Village | Revenue + Savings | O&M | Net Surplus | Payback |
|---|---|---|---|---|
| 1,000 | INR 1.56 Cr | INR 1.11 Cr | INR 0.45 Cr | ~35 yrs |
| 2,500 | INR 3.80 Cr | INR 2.46 Cr | INR 1.34 Cr | ~25 yrs |
| 5,000 | INR 7.80 Cr | INR 4.62 Cr | INR 3.18 Cr | ~20 yrs |
| 10,000 | INR 16.00 Cr | INR 8.70 Cr | INR 7.30 Cr | ~17 yrs |
With government subsidies on solar (PM-KUSUM, state schemes) covering 30–60% of energy costs, and MGNREGA funding for water body construction, the effective payback period drops to 10–15 years for all village sizes. After that, the village is not only self-sufficient — it is profitable.
10. The Complete Cost Sheet: One Table to Take to the Government
This is the table to print, laminate, and place on every bureaucrat’s desk and every politician’s podium.
Total Investment Required (in INR Crore)
VILLAGE OF 1,000 PEOPLE
| Item | INR Crore |
|---|---|
| Energy (Solar/Wind/Storage/Grid) | 4.32 |
| Food & Agriculture | 2.95 |
| Water Resources | 1.96 |
| Biogas / Cooking Fuel | 1.19 |
| Village Infrastructure | 3.00 |
| Livelihoods & Enterprise | 0.93 |
| Contingency & PM (10%) | 1.44 |
| Initial Capital (A) | 15.79 |
| Year 1–10 O&M (B) | 11.10 |
| Year 10 Replacement (C) | 2.80 |
| Total 10-Year Cost (A+B+C) | 29.69 |
| Year 1–10 Revenue + Savings (D) | 15.60 |
| Net 10-Year Cost | 14.09 |
| Per Capita (10-year) | INR 1,40,900 |
VILLAGE OF 2,500 PEOPLE
| Item | INR Crore |
|---|---|
| Energy (Solar/Wind/Storage/Grid) | 9.88 |
| Food & Agriculture | 6.77 |
| Water Resources | 4.16 |
| Biogas / Cooking Fuel | 2.88 |
| Village Infrastructure | 4.73 |
| Livelihoods & Enterprise | 1.93 |
| Contingency & PM (10%) | 3.04 |
| Initial Capital (A) | 33.39 |
| Year 1–10 O&M (B) | 24.60 |
| Year 10 Replacement (C) | 6.20 |
| Total 10-Year Cost (A+B+C) | 64.19 |
| Year 1–10 Revenue + Savings (D) | 38.00 |
| Net 10-Year Cost | 26.19 |
| Per Capita (10-year) | INR 1,04,760 |
VILLAGE OF 5,000 PEOPLE
| Item | INR Crore |
|---|---|
| Energy (Solar/Wind/Storage/Grid) | 19.89 |
| Food & Agriculture | 13.01 |
| Water Resources | 7.94 |
| Biogas / Cooking Fuel | 5.62 |
| Village Infrastructure | 8.52 |
| Livelihoods & Enterprise | 3.51 |
| Contingency & PM (10%) | 5.85 |
| Initial Capital (A) | 64.34 |
| Year 1–10 O&M (B) | 46.20 |
| Year 10 Replacement (C) | 12.00 |
| Total 10-Year Cost (A+B+C) | 122.54 |
| Year 1–10 Revenue + Savings (D) | 78.00 |
| Net 10-Year Cost | 44.54 |
| Per Capita (10-year) | INR 89,080 |
VILLAGE OF 10,000 PEOPLE
| Item | INR Crore |
|---|---|
| Energy (Solar/Wind/Storage/Grid) | 39.78 |
| Food & Agriculture | 25.18 |
| Water Resources | 15.15 |
| Biogas / Cooking Fuel | 10.95 |
| Village Infrastructure | 15.95 |
| Livelihoods & Enterprise | 6.37 |
| Contingency & PM (10%) | 11.34 |
| Initial Capital (A) | 124.72 |
| Year 1–10 O&M (B) | 87.00 |
| Year 10 Replacement (C) | 23.00 |
| Total 10-Year Cost (A+B+C) | 234.72 |
| Year 1–10 Revenue + Savings (D) | 160.00 |
| Net 10-Year Cost | 74.72 |
| Per Capita (10-year) | INR 74,720 |
What This Means
For less than INR 1.5 lakh per person over ten years — or INR 14,000 per person per year — a village of 1,000 people can have clean electricity around the clock, enough food for every nutritional need, clean drinking water, cooking gas from biogas, a school, a health centre, a sports ground, internet, and dignified employment for every adult. For a larger village of 10,000, the number drops below INR 75,000 per person per year.
The central government spends approximately INR 2,500 per person per year on just food subsidies through the PDS. Add LPG, MGNREGA, PM-KISAN, free electricity schemes, and assorted state-level freebies, and the annual subsidy spending per rural Indian is well above INR 15,000–20,000 — with no path to self-sufficiency.
The choice is between spending INR 14,000 per person per year for ten years and creating a permanently self-reliant village, or spending INR 15,000+ per person per year forever and creating permanent dependence.
11. The Ideal Village: A Day in the Life
Imagine waking in a village where the street lights ran all night on solar-stored power. The biogas stove in every kitchen hisses to life, fuelled by yesterday’s cactus and cow dung, cooking breakfast with zero carbon emissions. Children walk to a school whose fans and computers run on the rooftop panels above. A farmer checks the moisture sensor on his drip-irrigated field — the water drawn from a solar-powered borewell recharging from last monsoon’s harvested rain — while above his crops, elevated solar panels generate electricity that the village cooperative sells to the grid for extra income.
At the dairy, fresh milk is pasteurised using solar thermal energy. At the polyhouse, hydroponically grown lettuce and herbs are packed for the weekly market. At the sports centre, floodlights powered by the village micro-grid illuminate an evening kabaddi match. At the health centre, a telemedicine consultation connects a villager to a specialist in the district hospital via the village’s fibre-optic internet.
Nobody here received a freebie. Everyone here has work. The village feeds itself, powers itself, hydrates itself, heals itself, and educates its children — and it has money left over.
This is not a fantasy. Every component described in this article is already operational somewhere in India. At BAIF’s campus in Uruli Kanchan, thirteen agrivoltaic models, community biogas, cactus plantations, indigenous cattle programmes, polyhouse hydroponics, and green hydrogen pilots all function side by side on 65 acres of undulating, challenging terrain.
The money exists. The technology exists. The land exists. The knowledge exists.
What is needed now is the decision.
Methodology Note
All cost estimates are based on 2025–26 market rates for equipment, construction, and agricultural inputs in Maharashtra and neighbouring states. Solar costs reflect MNRE benchmark rates. Agricultural yields use ICAR averages for improved varieties under irrigated conditions. The dietary model follows ICMR-NIN Recommended Dietary Allowances (2020). Land requirements assume reasonably fertile soil with proper soil health management; for degraded or arid land, add 15–25% to crop area. All figures exclude land acquisition costs, which vary enormously by region — the model assumes village common land, government wasteland allocation, or existing agricultural holdings.
Disclaimer
This article was developed with the assistance of AI to model, calculate, and structure the complex cost estimations presented here. While every effort has been made to use realistic benchmarks drawn from government data, ICMR guidelines, MNRE rates, and field observations at BAIF Development Research Foundation, the numbers in this article are estimations — not engineering quotations. Actual costs will vary based on geography, soil type, local labour rates, material prices, state-specific subsidies, land availability, and dozens of other on-ground variables. This is an attempt to frame the problem with credible ballpark figures so that the conversation can move from “Is it even possible?” to “How do we start?” Policymakers, development agencies, and village communities are encouraged to commission detailed project reports (DPRs) for their specific contexts. The intent here is to provoke action, not to replace professional feasibility studies.
The Veg/Non-Veg dietary factor can be applied to the food and agriculture line items. For a 70% vegetarian village, multiply food costs by 0.70 + (0.65 × 0.30) = 0.895. For a fully vegetarian village, multiply by 0.70.
The author visited BAIF Development Research Foundation’s agrivoltaic pilot project and bio-resource centre at Uruli Kanchan, Pune, as part of a field visit organised by the Earth Journalism Network.
Watch the installations: Agrivoltaic Farming at BAIF | Solar Panel Types | Director Interview
Frequently Asked Questions
Q1. Is INR 125 crore for a village of 10,000 people realistic? Where will this money come from?
INR 125 crore sounds like a large number until you compare it to what the government already spends. India’s annual subsidy bill on food, fuel, and fertiliser alone exceeds INR 5 lakh crore. Redirecting even a fraction of recurring subsidies toward one-time capital investment in village self-sufficiency would cover thousands of villages. Additionally, existing central schemes — PM-KUSUM for solar, MGNREGA for water body construction, Jal Jeevan Mission for piped water, Gobardhan for biogas — already fund individual components. The challenge is convergence: putting all these schemes together in one village with a unified plan, rather than scattering them across disconnected projects.
Q2. Does this model work for every village in India, regardless of geography?
The core framework applies everywhere, but the numbers will shift. A village in arid Rajasthan will need more investment in water harvesting and less in drainage. A village in the Northeast will have lower solar yield but higher hydropower potential. A coastal village can substitute fish ponds with marine aquaculture. The cost estimates in this article use Maharashtra as a baseline; for other states, a 15–25% variation in either direction is reasonable. The principles — local energy, local food, local water, local livelihoods — are universal.
Q3. What if the village does not have 350 acres (for pop. 1,000) of available land?
Land is the biggest variable. If common land or government wasteland is unavailable, the model relies more heavily on intensive techniques: vertical farming, hydroponics, multi-tier cropping, agrivoltaic dual-use, and higher-yield varieties. These reduce land needs by 20–30% but increase capital cost by 10–15%. For very land-scarce villages, a cluster approach — where 3–4 neighbouring villages share agricultural land and energy infrastructure — may be more practical.
Q4. You mention 50% vegetarian and 50% non-vegetarian. How does cost change if the village is fully vegetarian?
A fully vegetarian village eliminates the need for poultry sheds, fish ponds, and a portion of fodder land (though dairy cattle remain for milk and biogas dung). The food and agriculture cost drops by approximately 30% — applying the dietary factor of 0.70 explained in the article. For a village of 10,000, this means food costs fall from INR 25.18 Cr to roughly INR 17.63 Cr, reducing the grand total by about INR 7.5 Cr. Conversely, a fully non-vegetarian village would see food costs rise by about 35%.
Q5. What about healthcare and education running costs — teachers’ salaries, medicines, doctor visits?
Teacher and health worker salaries are included in the annual O&M under “Salaries.” The model assumes a mix of government-posted staff (whose salaries come from state budgets, as they do today) and locally hired support staff paid from village revenues. Medicines and medical supplies for the primary health centre are budgeted within O&M. For specialist care, the digital infrastructure enables telemedicine; serious cases would still require referral to district hospitals, as is normal for rural India. The goal is primary self-sufficiency, not building a tertiary hospital in every village.
Q6. What happens if the biogas plant fails or cactus does not grow well in a particular soil?
Biogas technology is well-established in India — over 50 lakh household plants have been built under the National Biogas Programme. Community-scale plants are more complex but BAIF and others have demonstrated reliable operation. Spineless cactus is a xerophyte that grows in remarkably poor soil — BAIF has demonstrated it on rocky, undulating terrain. However, if cactus is unsuitable (e.g., waterlogged land), alternative feedstock like crop residue, water hyacinth, or kitchen waste can partially substitute. The model has enough flexibility to swap feedstock without changing the biogas infrastructure.
Q7. How does this compare to what Smart Cities Mission or RURBAN clusters have spent?
The Smart Cities Mission allocated INR 48,000 crore for 100 cities — an average of INR 480 crore per city. The Shyama Prasad Mukherji RURBAN Mission allocated INR 5,142 crore for 300 clusters. Both are urban-centric and focus on infrastructure rather than self-sufficiency. This model costs INR 125 crore for a village of 10,000 but delivers something neither programme attempts: complete independence from external supply chains for energy, food, water, and fuel. It is not a comparison of cost but a comparison of ambition.
Q8. Can this model generate employment for all working-age adults?
For a village of 1,000, there are approximately 550 working-age adults. The model creates employment across agriculture (220 jobs), value addition and processing (110), energy management (55), services like teaching, health, administration (110), and skilled trades (55). These are not make-work programmes — each role is tied to a productive output the village consumes or sells. Seasonal agricultural labour is balanced by year-round activities like dairy, biogas operation, solar maintenance, and food processing.
Q9. What role does the government need to play beyond funding?
Three critical roles. First, land allocation — making government wasteland or common land available for village use under long-term lease. Second, policy convergence — creating a single-window mechanism to channel PM-KUSUM, MGNREGA, Jal Jeevan, Gobardhan, and state schemes into one integrated village plan instead of running them in silos. Third, technical handholding for the first 3–5 years — through institutions like BAIF, ICAR, or state agricultural universities — until the village builds its own operational capacity.
Q10. Has any village in India actually achieved full self-sufficiency?
Ralegan Siddhi (Maharashtra) and Hiware Bazar (Maharashtra) are often cited as model villages, and both achieved remarkable water and agricultural self-sufficiency through watershed management and community governance. However, neither is fully energy-independent or runs a complete biogas-for-cooking system at village scale. The BAIF campus at Uruli Kanchan demonstrates all the individual technologies working together on 65 acres, but applying the full integrated model to an actual revenue village is the next step. This article is an invitation to take that step.
Q11. What about natural disasters — floods, droughts, cyclones? Does this model account for resilience?
The model builds in resilience through diversification. Solar plus wind plus biogas means no single energy source is a point of failure. Multiple water sources — rainwater, borewells, farm ponds, recycled wastewater — reduce drought vulnerability. The buffer and commons land (44–340 acres depending on village size) provides ecological cushion. The contingency budget (10% of capital) is partly an insurance buffer. However, catastrophic events would require external disaster relief, as they do for any settlement. The difference is that a self-sufficient village recovers faster because its systems are local, repairable, and not dependent on distant supply chains.
Q12. Can I use this model to pitch to my local MLA, MP, or District Collector?
That is exactly why this article exists. Section 10 — “The Complete Cost Sheet: One Table to Take to the Government” — is designed to be a one-page summary for policymakers. Print it. Share it. The numbers are estimates and will need a formal Detailed Project Report (DPR) for any specific village, but the order of magnitude is sound: INR 1.25 to INR 1.58 lakh per person as one-time capital, with full payback in 15–20 years. The question to ask the politician is simple: would you rather keep spending INR 15,000+ per person per year on subsidies forever, or invest INR 1.5 lakh per person once and never need to again?
Some Open ended Questions(Food for thought) which this article answers!
- INR 125 Crore to Free a Village Forever — Why Won’t India Spend It?
- The Price of a Self-Reliant Village Is Less Than One Year of Freebies
- Stop Feeding Villages. Fund Them. Here’s Exactly How Much It Costs
- What If India Built Villages Instead of Buying Votes?
- INR 1.5 Lakh Per Person: The One-Time Cost to End Rural Dependence Forever
- Freebies Create Beggars. Investment Creates Villages. Here Are the Numbers
- India Spends INR 5 Lakh Crore on Subsidies Every Year. Here’s What INR 125 Crore Can Do Instead
- The INR 125 Crore Blueprint: How to Make an Indian Village Owe Nothing to Anyone
- One Village. Zero Dependence. Here’s the Bill
- From Handouts to Harvests: The Exact Cost of Making an Indian Village Self-Sufficient